Digital Opsessions
Bi-weekly insights on maximizing productivity and empowering teams with Notion.
📈📊📈 🫨
Charts have finally arrived in Notion 👀
One of the most requested features in Notion has finally arrived — charts! Launched just two days ago, this update addresses a long-standing gap in the platform.
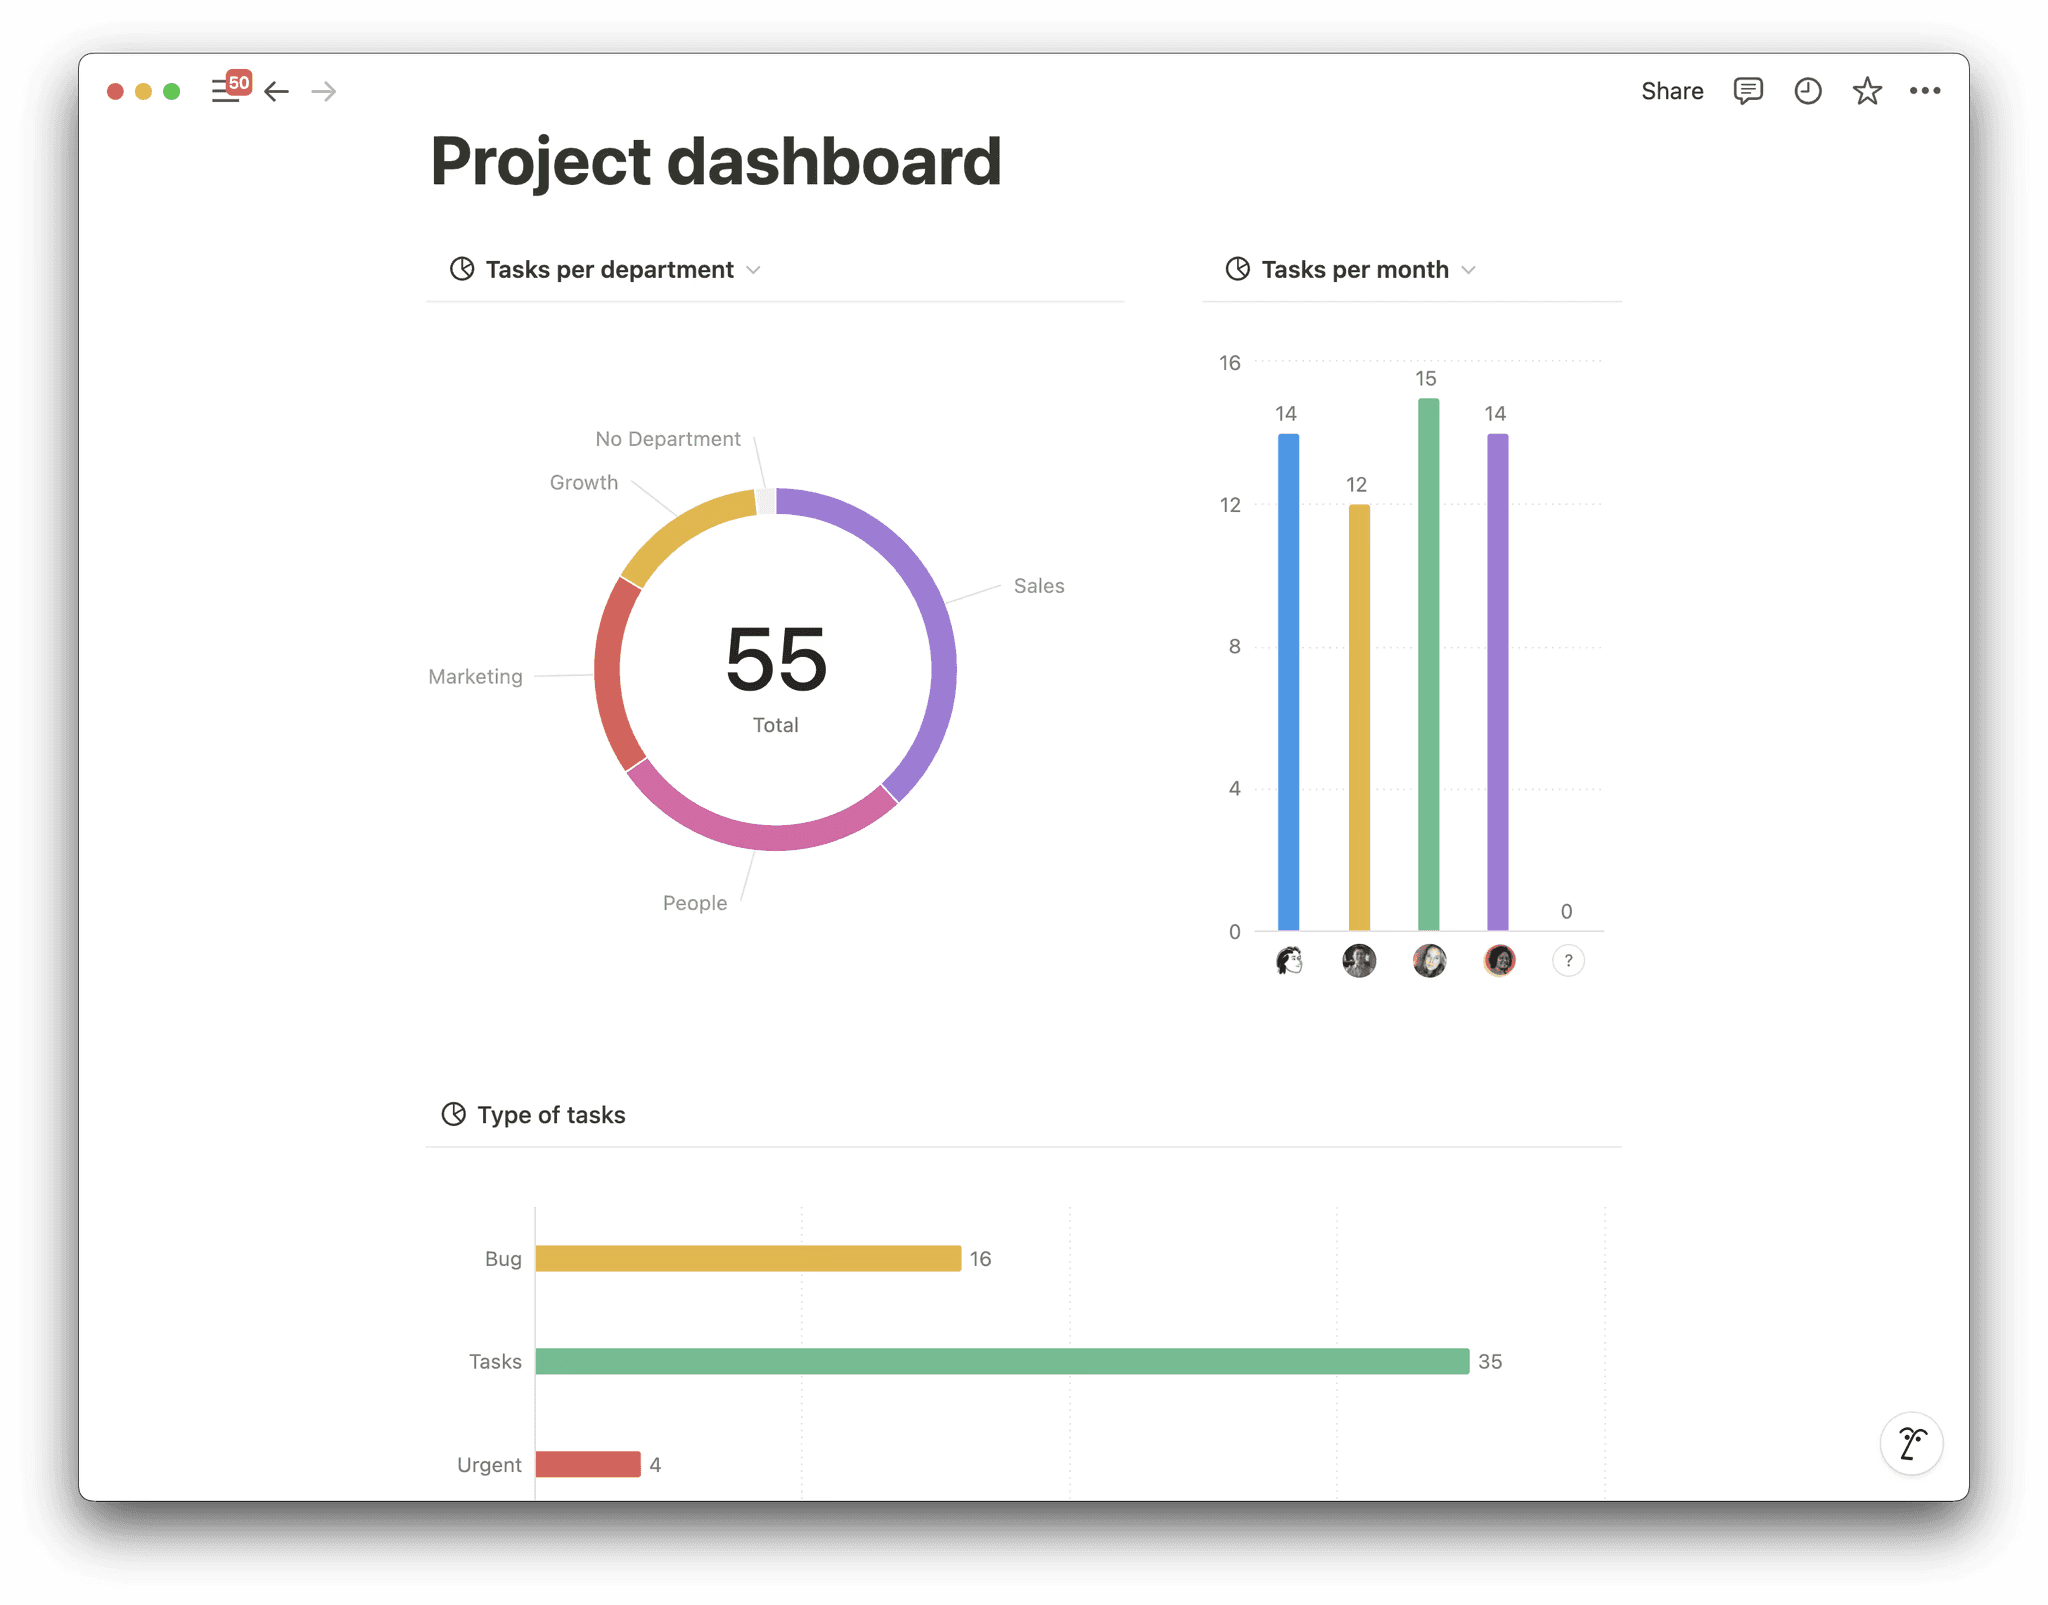
For years, Notion users have built their setups around databases, but visualizing all that data has always been a challenge. Whether you're tracking team tasks, managing projects, or monitoring metrics, charts now make it easier to see the bigger picture at a glance.
In this week's newsletter, we're diving into this new feature and providing some inspiration to help you fully leverage it with your team.

Getting started
Creating charts in Notion is straightforward. Here are two easy ways to do it:
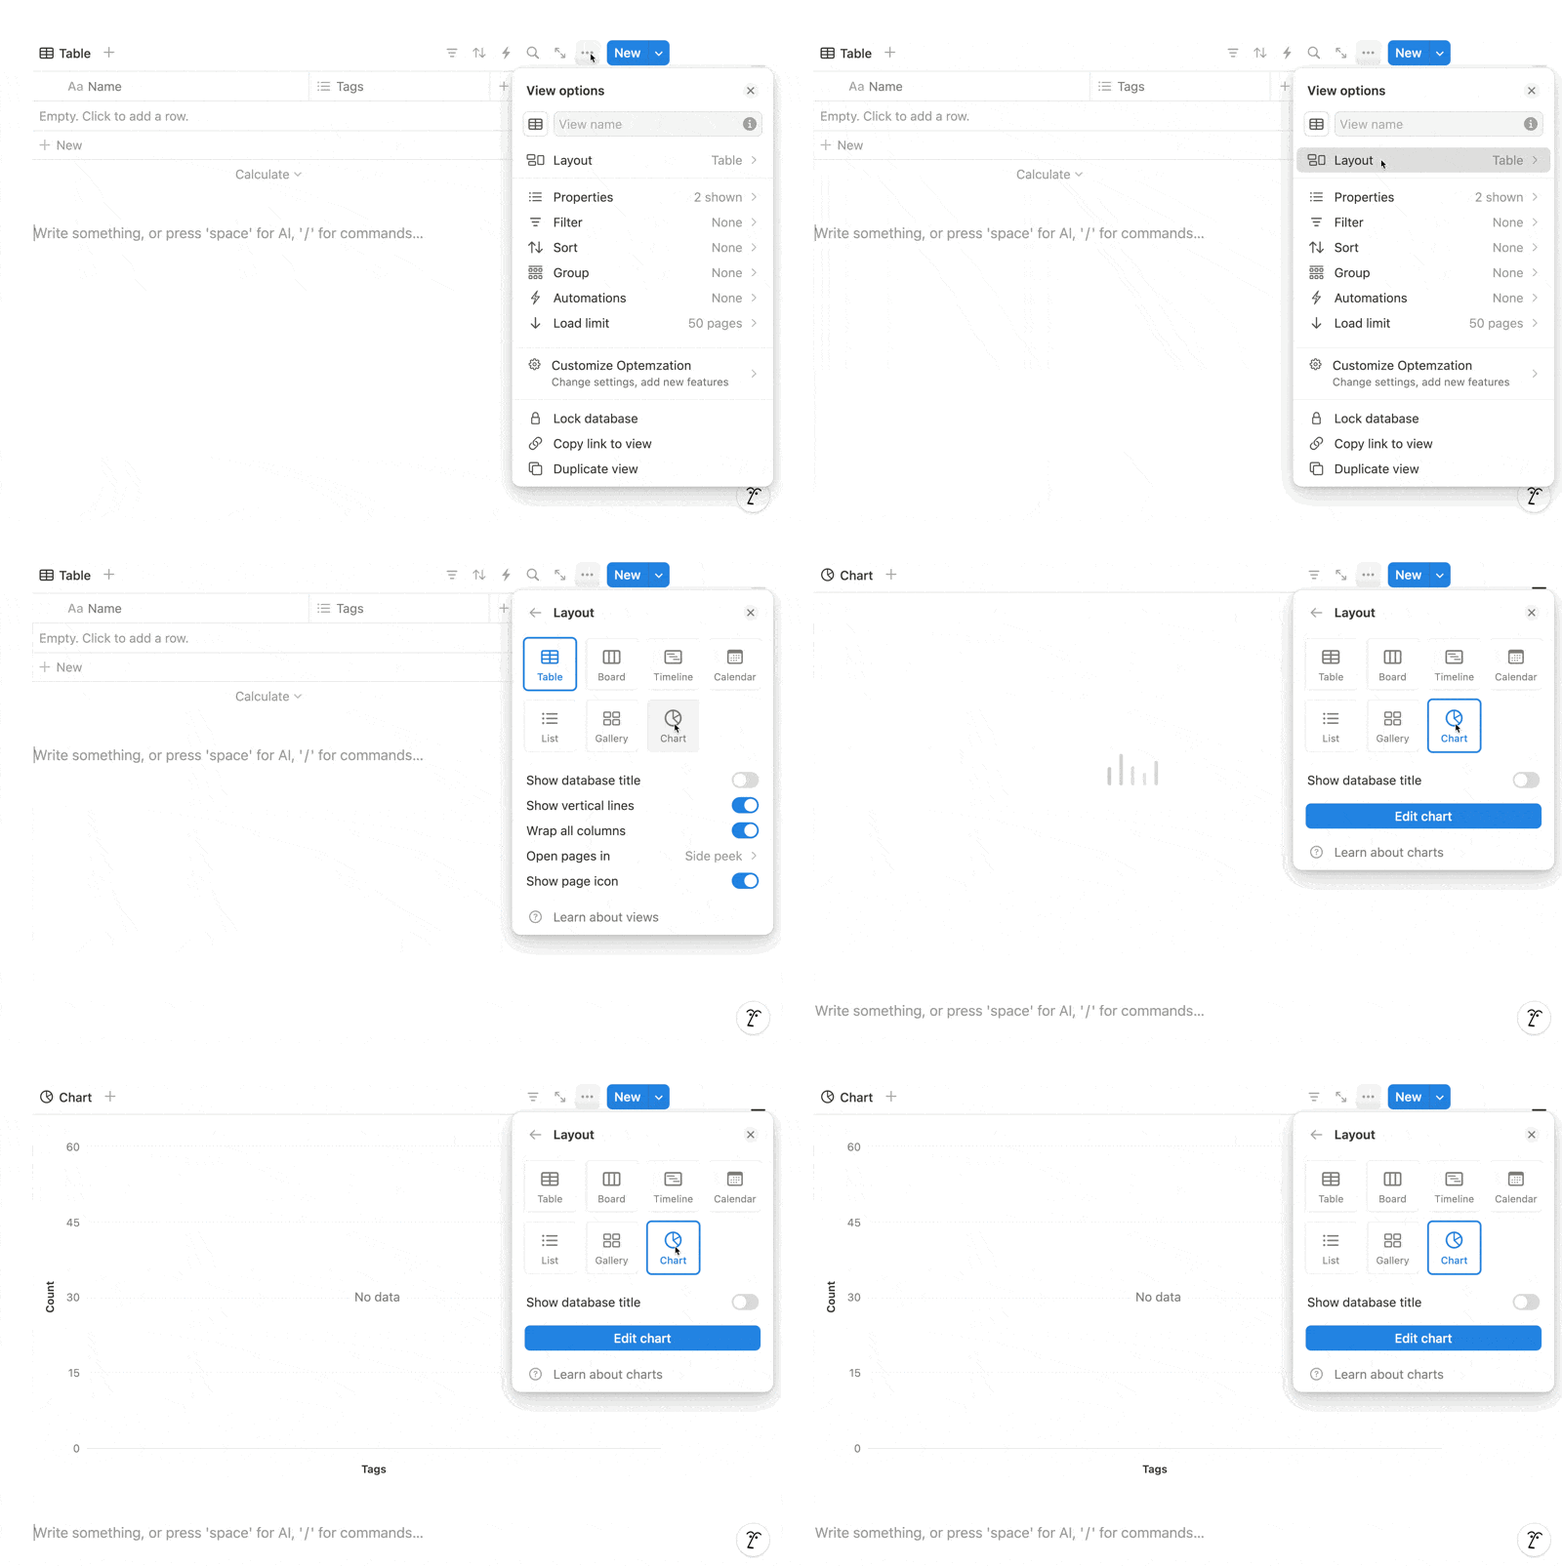
Add a chart view to an existing database: If you have a Notion database, you can easily add a chart view, just like adding a table, board, or calendar.

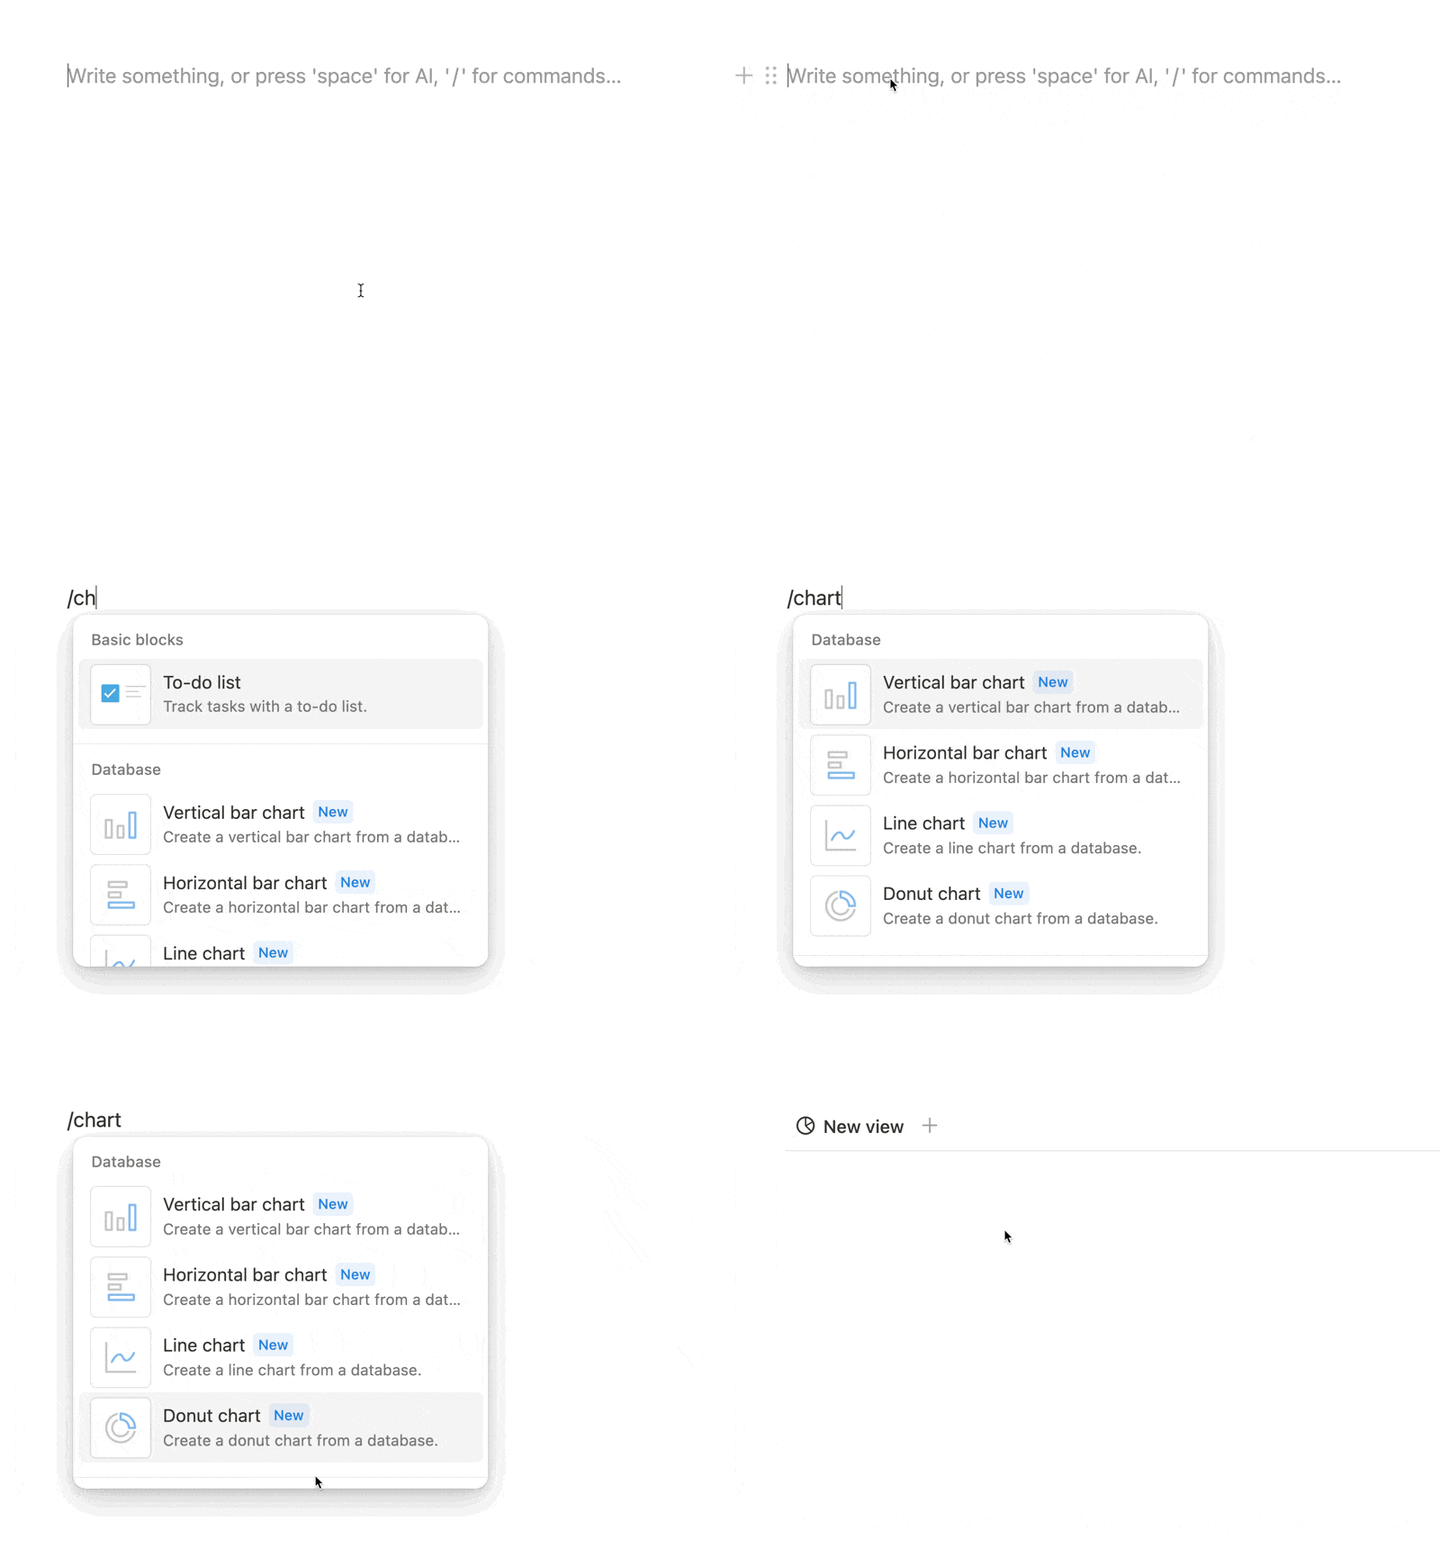
Insert a chart directly into a page: To add a chart to a specific page, type /chart and choose your desired chart type. This is great for creating dashboards or reports with visual data.

Types of charts
Notion’s chart feature includes four distinct types, each offering unique ways to visualize and analyze data across various departments.

Vertical Bar Chart: Vertical bar charts are perfect for comparing categories, such as tracking the number of tasks by status or project. In Marketing, for example, you could use a vertical bar chart to compare the number of leads generated from different campaigns, helping you quickly identify the most effective strategies.
Horizontal Bar Chart: Horizontal bar charts work well when the X-axis has many options, making it easier to analyze complex data. In Engineering, this chart type could be used to compare code contributions across different projects, allowing you to see which projects are receiving the most attention or resources.
Line Chart: Line charts are ideal for visualizing trends over time or relationships between variables. In Finance, a line chart could be used to track cash flow trends, such as comparing monthly expenses against revenue over the course of a year, helping to identify patterns and inform financial decisions.
Donut (Ring) Chart: Donut charts are great for representing proportions, showing how a whole is divided into parts. In HR/People, you might use a donut chart to display the composition of your workforce by department, giving a clear visual of how resources are distributed across the organization.
As you can see, the introduction of charts in Notion opens up a whole new way to visualize and interact with your data. Whether you're looking to get a quick overview of your team's progress, analyze trends over time, or better understand your resources, this new feature makes it easier than ever to bring your data to life.
If you're eager to dive deeper into this new feature and explore more ways to enhance your Notion setup, be sure to check out our latest blog post. We've created a more detailed guide with several visual examples.
Until next time, happy charting!
Roxana, and the⚡️Optemization team
Roxana, and the⚡️Optemization team

Roxana, and the⚡️Optemization team

Roxana, and the⚡️Optemization team
